1
2
3
4
5
6
7
8
9
10
11
12
13
14
15
16
17
18
19
20
21
22
23
24
25
26
27
28
29
30
31
32
33
34
35
36
37
38
39
40
41
42
43
44
45
46
47
48
49
50
51
52
53
54
55
56
57
58
59
60
61
62
63
64
65
66
67
68
69
70
71
72
73
74
75
76
77
78
79
80
81
82
83
84
85
86
87
88
89
90
91
92
93
94
95
96
97
98
99
100
101
102
103
104
105
106
107
108
109
110
111
112
113
114
115
116
117
118
119
120
121
122
123
124
125
126
127
128
129
130
131
132
133
134
135
136
137
138
139
140
141
142
143
144
145
146
147
148
149
150
151
152
153
154
155
156
157
158
159
160
161
162
163
164
165
166
167
168
169
170
| import gdal
from gdalconst import *
import numpy as np
from glob import glob
from os import path as osp
import os, subprocess
import matplotlib.pyplot as plt
def get_data(file_ndvi,file_lst):
ndvi_tif=gdal.Open(file_ndvi,GA_ReadOnly)
lst_tif=gdal.Open(file_lst,GA_ReadOnly)
ndvi_band=ndvi_tif.GetRasterBand(1)
ndvi=ndvi_band.ReadAsArray()
lst_band=lst_tif.GetRasterBand(1)
lst=lst_band.ReadAsArray()
return ndvi,lst
def get_info(file_ndvi):
ndvi_tif=gdal.Open(file_ndvi,GA_ReadOnly)
ndvi_band=ndvi_tif.GetRasterBand(1)
gt = ndvi_tif.GetGeoTransform()
proj = ndvi_tif.GetProjectionRef()
dtype = ndvi_band.DataType
return gt,proj,dtype
def get_min_max(ndvi,lst):
MiniList = []
MaxList = []
ndvi_vector = np.round(np.arange(0.01, 1.01, 0.01), 2)
for val in ndvi_vector:
lst_lst_val = []
row, col = np.where((ndvi >= val-0.001) & (ndvi <= val+0.001))
for i in range(len(row)):
if np.isfinite(lst[row[i], col[i]]):
lst_lst_val += [lst[row[i], col[i]]]
if lst_lst_val != []:
lst_min_val = np.min(lst_lst_val)
lst_max_val = np.max(lst_lst_val)
else:
lst_min_val = np.nan
lst_max_val = np.nan
MiniList += [lst_min_val]
MaxList += [lst_max_val]
return MiniList,MaxList
def fit(MiniList,MaxList):
ndvi_vector = np.round(np.arange(0.01, 1.01, 0.01), 2)
MiniList_fin = []
ndvi_fin = []
for i, val in enumerate(MiniList):
if np.isfinite(val):
MiniList_fin += [val]
ndvi_fin += [ndvi_vector[i]]
MinPfit = np.polyfit(ndvi_fin[14:89], MiniList_fin[14:89], 1)
MaxList_fin = []
ndvi_fin = []
for i, val in enumerate(MaxList):
if np.isfinite(val):
MaxList_fin += [val]
ndvi_fin += [ndvi_vector[i]]
MaxPfit = np.polyfit(ndvi_fin[14:89], MaxList_fin[14:89], 1)
return MinPfit,MaxPfit
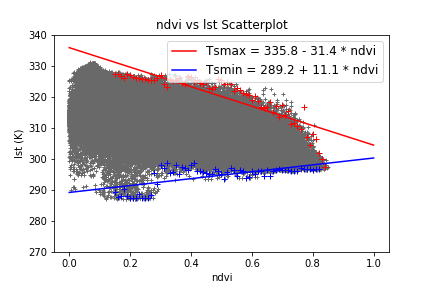
def plot_scatter(ndvi,lst,MiniList,MaxList,MinPfit,MaxPfit,scatter_file=None):
ndvi_vector = np.round(np.arange(0.01, 1.01, 0.01), 2)
a1, b1 = MaxPfit
a2, b2 = MinPfit
linhamax = [b1 + (a1 * 0), b1 + (a1 * 1)]
linhamin = [b2 + (a2 * 0), b2 + (a2 * 1)]
plt.plot(ndvi.ravel(), lst.ravel(), "+", color='dimgray', markersize=4)
plt.plot(ndvi_vector[14:89], MiniList[14:89], '+', color='b')
plt.plot(ndvi_vector[14:89], MaxList[14:89], '+', color='r')
if a1>0:
plt.plot([0, 1], linhamax, color='r', markersize=8,\
label=f"Tsmax = {'%.1f'% b1} + {'%.1f' % abs(a1)} * ndvi")
else:
plt.plot([0, 1], linhamax, color='r', markersize=8,\
label=f"Tsmax = {'%.1f'% b1} - {'%.1f' % abs(a1)} * ndvi")
if a2>0:
plt.plot([0, 1], linhamin, color='b', markersize=8,\
label=f"Tsmin = {'%.1f' % b2} + {'%.1f' % abs(a2)} * ndvi")
else:
plt.plot([0, 1], linhamin, color='b', markersize=8,\
label=f"Tsmin = {'%.1f' % b2} - {'%.1f' % abs(a2)} * ndvi")
plt.legend(loc='upper right', fontsize=12)
plt.ylim(top=340,bottom=270)
plt.xlabel("ndvi")
plt.ylabel("lst (K)")
plt.title("ndvi vs lst Scatterplot")
if scatter_file is not None:
plt.savefig(scatter_file)
plt.show()
def show_tvdi(tvdi,fig_file=None):
plt.imshow(tvdi,cmap= 'jet_r',vmax=1,vmin = 0)
plt.axis('off')
plt.colorbar()
plt.title("tvdi")
if fig_file is not None:
plt.savefig(fig_file)
plt.show()
def compute_tvdi(ndvi,lst,MinPfit,MaxPfit):
a1, b1 = MaxPfit
a2, b2 = MinPfit
Ts_max = b1 + (a1 * ndvi)
Ts_min = b2 + (a2 * ndvi)
TVDI = (lst - Ts_min) / (Ts_max - Ts_min)
return TVDI
def save_tvdi(TVDI,gt,proj,dtype,file_out):
fname_out = file_out
driver = gdal.GetDriverByName('GTiff')
data_type = dtype
dset_output = driver.Create(fname_out, TVDI.shape[1], TVDI.shape[0], 1, gdal.GDT_Float32)
dset_output.SetGeoTransform(gt)
dset_output.SetProjection(proj)
dset_output.GetRasterBand(1).WriteArray(TVDI)
dset_output.FlushCache()
dset_output = None
def main(ndvi_file,lst_file,tvdi_file,scatter_file=None,fig_file=None):
'''
Parameters
----------
ndvi_file : the file of ndvi
lst_file : the file of lst
tvdi_file : the file use to save tvdi
scatter_file : the file use to save scatter
fig_file : the file use to save the figure of tvdi
'''
ndvi,lst=get_data(ndvi_file,lst_file)
ndvi[ndvi<0]=np.nan
lst[lst<250]=np.nan
MiniList,MaxList=get_min_max(ndvi,lst)
MinPfit,MaxPfit=fit(MiniList,MaxList)
tvdi=compute_tvdi(ndvi,lst,MinPfit,MaxPfit)
gt,proj,dtype=get_info(ndvi_file)
save_tvdi(tvdi,gt,proj,dtype,tvdi_file)
plot_scatter(ndvi,lst,MiniList,MaxList,MinPfit,MaxPfit,scatter_file)
show_tvdi(tvdi,fig_file)
if __name__ == '__main__':
ndvi_file=r'*.tif'
lst_file=r'*.tif'
tvdi_file=r'*.tif'
main(ndvi_file,lst_file,tvdi_file)
|